


January 23, 2020
Farm Data Usage in Commercial Agriculture
by Nathan DeLay, Nathanael Thompson, and James Mintert
![]()
![]()
![]()
![]()
![]()
Introduction
There is a lot of talk about “big data” in agriculture these days. The farm of the future is said to use multispectral imagery, soil and micro-climate sensors, equipment telematics data, and GPS to drive yield enhancing decisions. The growth of ag-tech startups suggests investors are optimistic about this future. Investment in the ag-tech sector grew 43% in 2018 to nearly $17 billion according to AgFunder News.[1] Though the amount of data being collected from farms is growing rapidly, little is known about how farmers leverage this data to make decisions. According the USDA’s Agricultural Resource Management Survey (ARMS), 61% of corn growers used a yield monitor in 2010 but only 34% used the data to generate a yield map, indicating a disconnect between data collection and data action. The nearly $1 billion sale of Climate Corp to Monsanto (now Bayer) highlighted the value of aggregating farm data with software platforms, but questions regarding farmers’ use of data services persist. What types of farm data software do farmers subscribe to, and to what extent does this software influence seed, nutrient and chemical decisions?
The Survey
To begin to answer these questions, researchers from Purdue University’s Center for Commercial Agriculture surveyed 800 corn and soybean producers about their collection, management, and usage of farm data. The survey was limited to farms with 1,000 acres or more to produce a sample of farms most likely to have active data strategies. The survey asked respondents 32 questions regarding farm demographic characteristics, precision agriculture adoption, types of data collected on the farm, farm management decisions influenced by data (if collected), data management practices, and any data sharing with outside service providers. The goal of the survey is to understand the farm data lifecycle from collection to decision making and the various channels through which data becomes actionable.
Sample Demographics
Sample farm characteristics are displayed in Table 1. Fifty percent of farms surveyed operate between 1,000 and 1,999 acres while 36% are between 2,000 and 4,999 acres, and 15% have 5,000 acres or more. The sample is more representative of large commercial operations (by design). About 80% of surveyed farms have owner/operators over the age of 50 and 35% are over the age of 65. Given the average age of producers in the U.S. is 59, our sample is generally representative of the national age distribution of farmers.[2] Just under half of sampled farms have a bachelor’s degree or higher as the highest educational attainment among full-time employees and 9% have a post-graduate degree (Master’s and up), indicating a high degree of human capital.
Precision Agriculture Adoption
High speed internet access is slightly more available among survey respondents than rural America as a whole at 80%. Generally, adoption rates of precision agriculture technologies reflect the large commercial size and crop mix of farms in the sample. GPS guidance or auto-steer for farm equipment is used by over 90% of the surveyed farms. Fifty-nine percent of farms use variable rate technology (VRT) for seeding and 71% use VRT for fertilizer application. Drones or unmanned aerial vehicles (UAVs) are used by 26% of sampled farms. The survey sample has significantly higher rates of precision agriculture adoption than the most recent estimated from the USDA Agricultural Resource Management Survey (ARMS) (see Schimmelpfennig, 2016) but are highly similar to work by Thompson et al. (2018) who use a similar sampling method.[3]
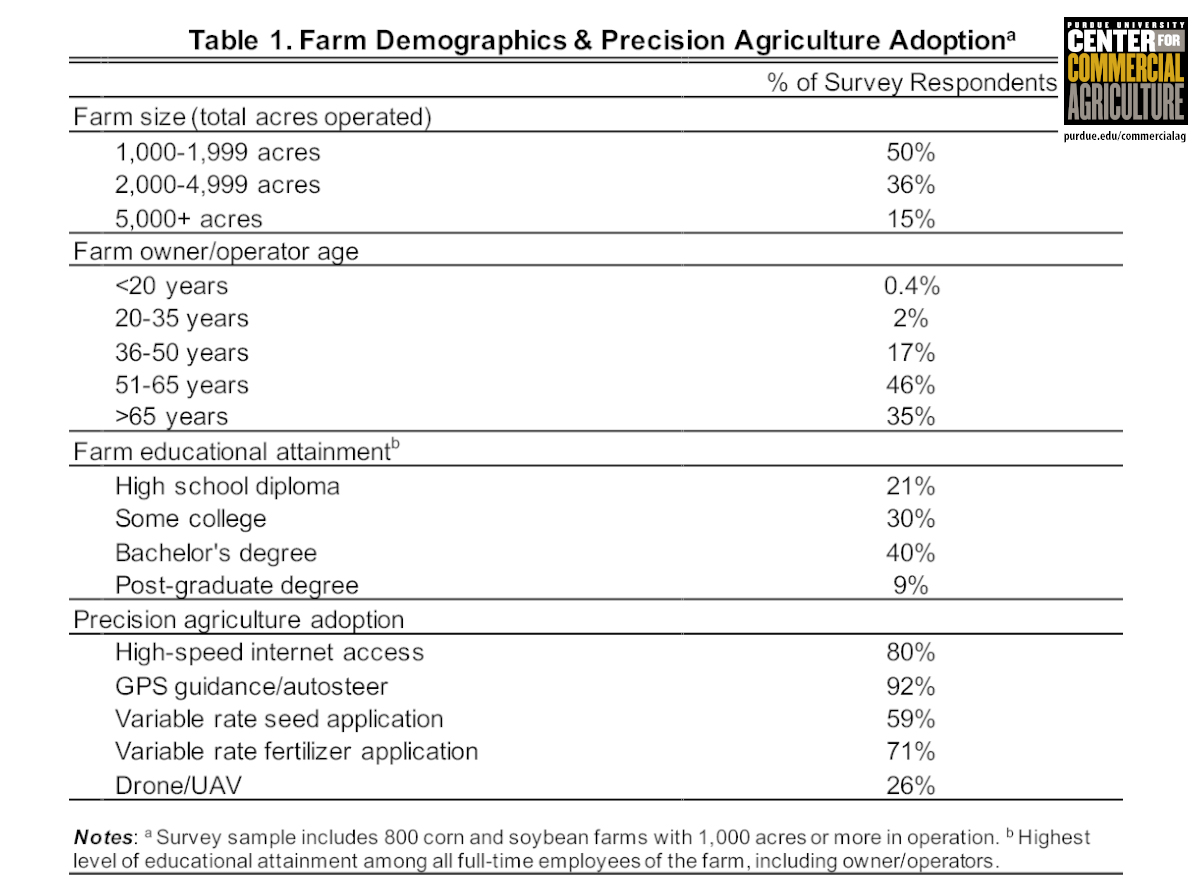
Table 1. Farm Demographics & Precision Agriculture Adoption
Data Collection
Farmer participants were first asked about their collection of three common types of farm data—yield monitor data, grid or zone soil sampling data, and drone or satellite imagery data. Collection among our sample is common—particularly for yield monitor and soil data at 82% and 77%, respectively. Satellite or drone imagery data is the least likely to be collected (47% of the sample) but given the novelty of the technology, this could be considered high. The vast majority (73%) create GPS maps from their data, suggesting a high degree of engagement with data once collected.
Data collection is strongly related to farm characteristics. Figure 1 displays the percentage of farms collecting each data type, broken down by farm size. Data collection is most prevalent among large farms—a result consistent with previous findings. [3] The relationship is most pronounced for drone or satellite imagery. Farms with 5,000 acres or more are 51% more likely to collect imagery data than farms in the 1,000-1,999-acre category. Collecting imagery data—particularly via drone—may involve scale economies that favor larger operations.

Figure 1. Types of Data Collected by Farm Size (Acres)
Farms with older operators are generally less prone to collect farm data, depending on the data type. Figure 2 shows 94% of farms with operators under the age of 36 collect yield monitor data vs. 80% of those over the age of 65. This should be interpreted with caution however, due to the low representation of young farmers in our sample (n = 17). The collection of soil sample data drops off significantly for operators over the age of 50, while a similarly sharp decline is observed for imagery data among those older than 65. As a group, operators age 65 and under are 29% more likely to collect drone or satellite imagery data than those over 65.

Figure 2. Types of Data Collected by Operator Age
Figure 3 depicts the relationship between farm educational attainment and data collection. Collection is positively associated with education, though beyond a Bachelor’s degree, yield monitor and soil sampling data collection rates are indistinguishable. Again, imagery data from a drone or satellite bears the clearest relationship to education. Thirty-eight percent of those with a high-school diploma collect imagery data vs. 59% of those with a post-graduate degree—a 55% difference. Simply going from no college to some college raises the likelihood of collecting imagery data by 16%. This strong correlation with educational attainment is likely due to the novelty and technical nature of imagery data relative to other forms of data, favoring those farms with technical skills at their disposal.
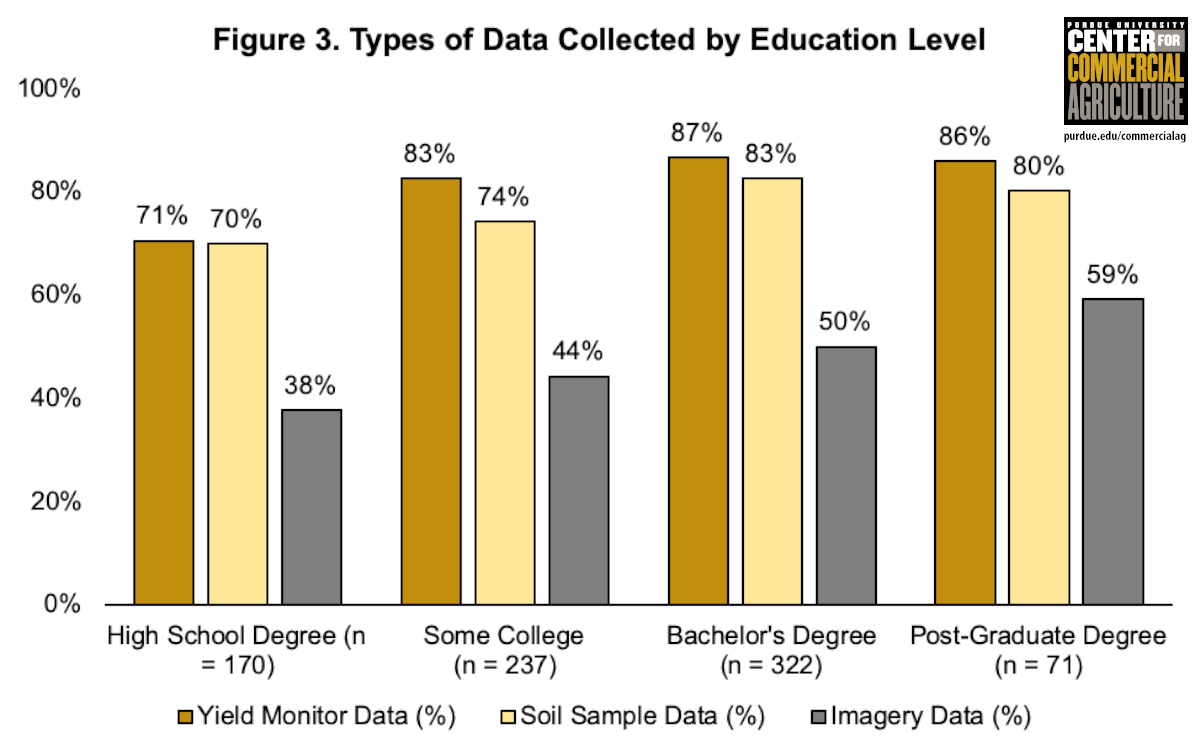
Figure 3. Types of Data Collected by Education Level
Of the 800 respondents, 58 (7%) do not collect any of the data types included in the survey. Non-data collectors identified the primary reason for not collecting farm data. Figure 4 shows the distribution of responses. Thirty-six percent said data collection is “too costly” while 19% find the benefits of doing so unclear. Taken together, over half of non-collectors perceive farm data to be un-profitable. Over one-third report uncertainty in how to use farm data once collected—suggesting a disconnect between collection and action. Surprisingly, only 10% of farms cited privacy concerns as the reason for not collecting farm data. Privacy may be of greater concern when it comes to storing and sharing farm data but does not appear to be a significant deterrent to collection.
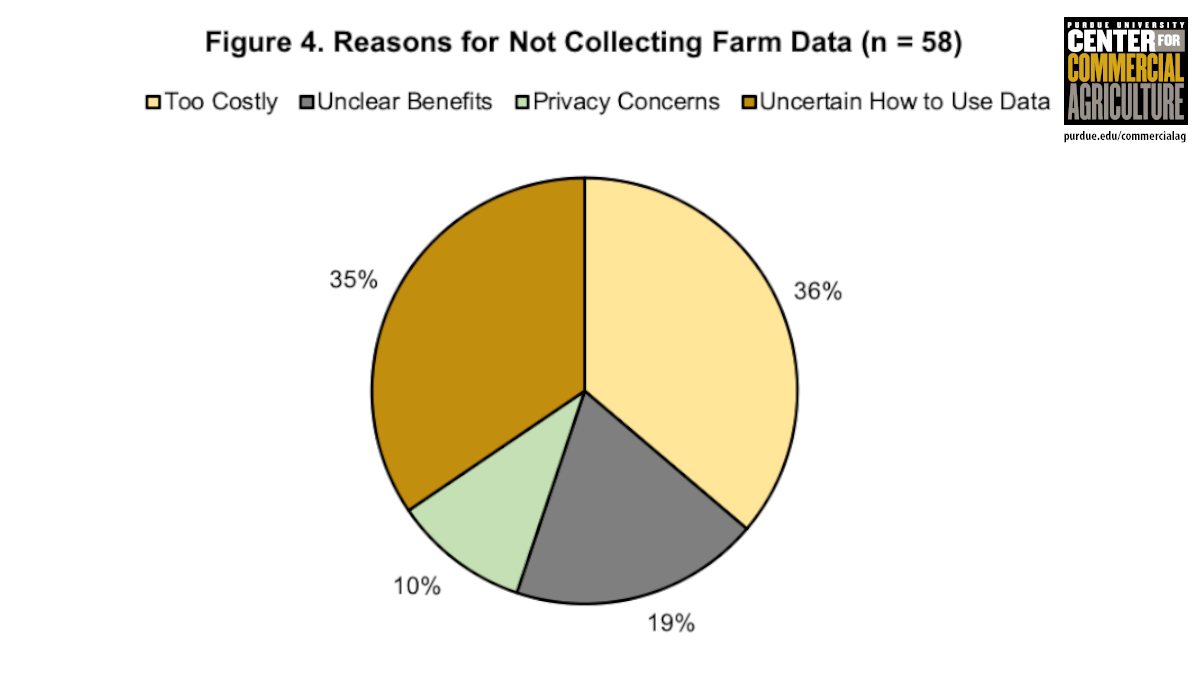
Figure 4. Reasons for Not Collecting Farm Data (n=58)
Among those not currently collecting data, few indicated that they will begin collecting data in the future—though differences emerge across data types (see Figure 5). Seventy-six percent are unlikely to begin collecting aerial imagery data compared to 43% for yield monitor data. Yield monitors often come standard on new combine harvesters—not requiring a dedicated investment of time and capital.
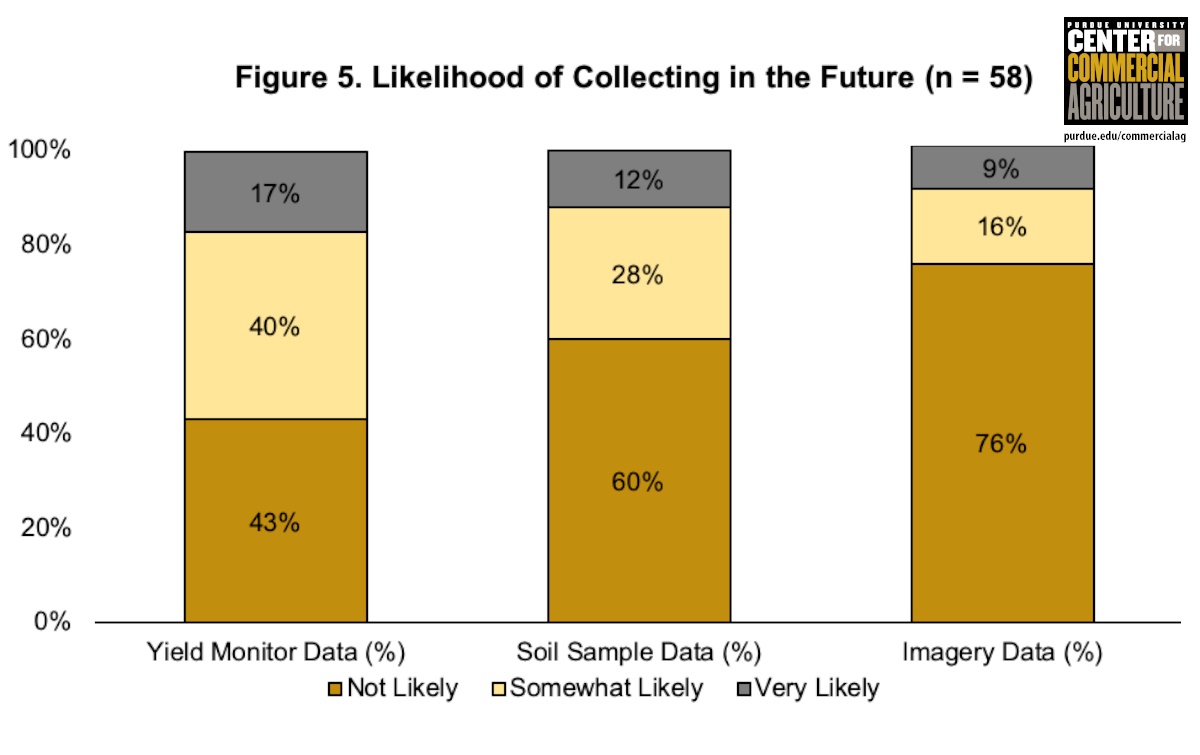
Figure 5. Likelihood of Collecting in the Future (n=58)
Data Decision Making
Farmers that currently collect data were asked to rate the extent to which their data influences their decision making in three crop management areas: seeding rates, nutrient management/fertilizer application, and drainage investments. Figure 6 summarizes the responses. Farm data appears to have the largest influence on nutrient management with 93% reporting their fertilizer decisions to be “somewhat” or “highly” influenced by data. The share of farms reporting seeding rate and drainage decisions as at least somewhat influenced by data is 81% and 71%, respectively. Fertilizer application decisions are nearly twice likely to be highly influenced by farm data as seeding rate and drainage investment decisions—reflecting the popularity of variable rate fertilizer application within the sample (see Table 1).
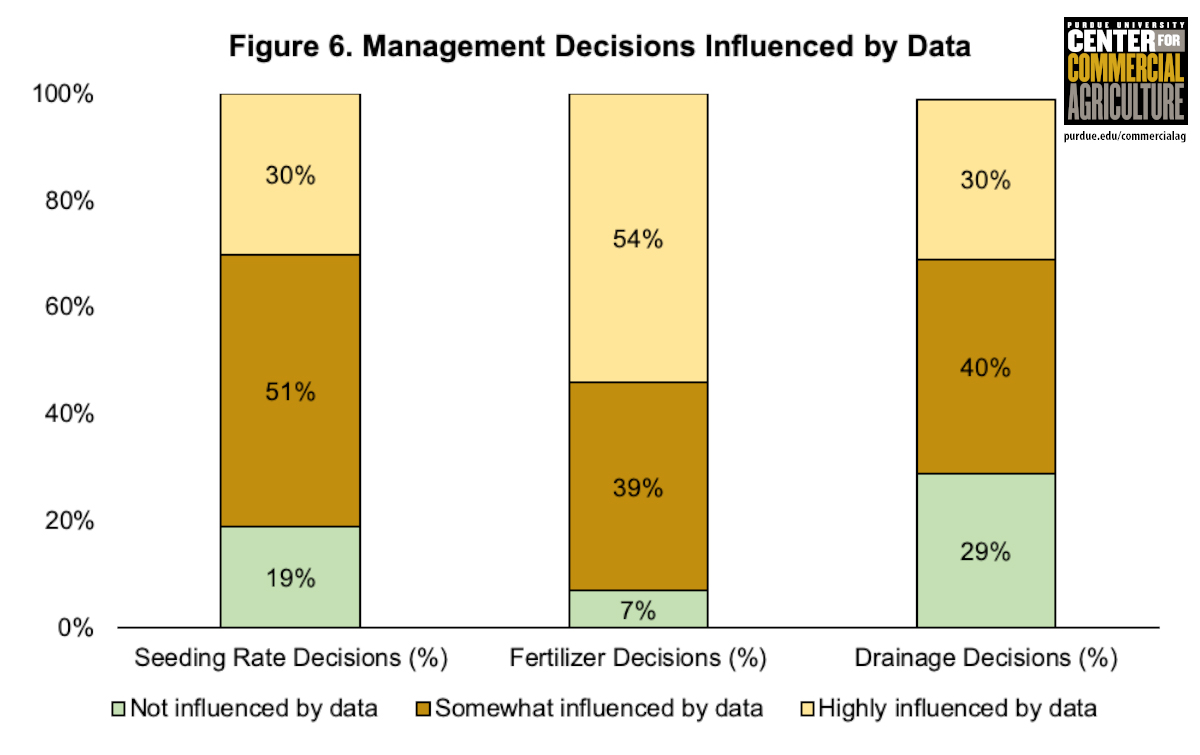
Figure 6. Management Decisions Influenced by Data
Farms making decisions based on their data appear satisfied with the results. Seventy-two percent of those making data-driven seeding rate decisions report a positive yield impact vs. 81% for fertilizer decisions and 85% for drainage decisions. Interestingly, drainage is the management decision least influenced by farm data. But those who use data in their draining investment decisions report the highest level of satisfaction. Levels of satisfaction rise as farmers collect more data types. For example, the proportion indicating a positive yield result from data-informed seeding rate decisions is 64% if the farm only collects only one type of data (e.g. just yield monitor data) but rises to 77% if the farm collects all three data types—a 21% increase. This suggests that the returns to data collection may be complementary, that is, individual data streams are made more actionable when combined with other data sources.
Data Management Practices
The survey broadly focuses on two data management practices in the farm data pipeline: adoption of farm data software platforms and sharing of data with outside service providers. Figure 7 shows the adoption rates of farm data software by farm size. Overall, 47% of farms that collect data use at least one data software product, but adoption rates are significantly higher among larger operations—63% of farms with 5,000 acres or more vs. 36% of farms in the 1,000-1,999-acre category.
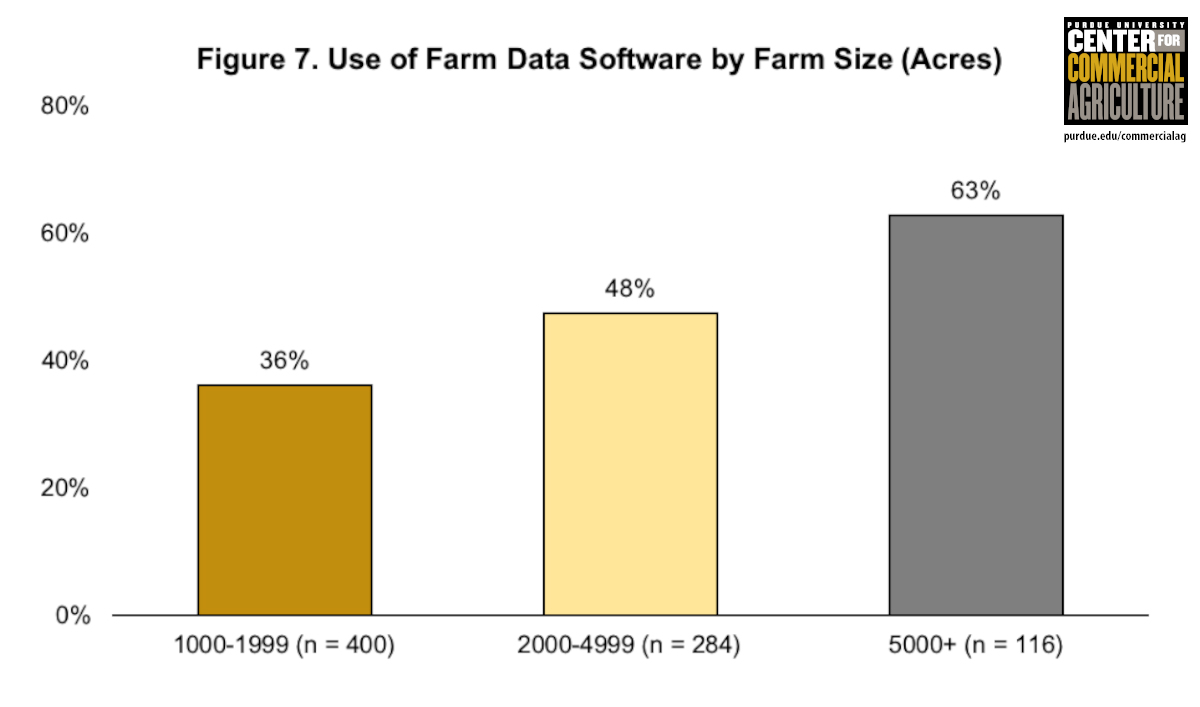
Figure 7. Use of Farm Data Software by Farm Size (Acres)
Farms with higher educational attainment have higher rates of farm data software adoption but the relationship varies by operator age. Figure 8 shows that, among operators over 65, those with some college are nearly twice as likely to use farm data software than those with a high school diploma.[4] Getting a Bachelor’s degree has a similar effect on adoption rates among those age 51-65. Software platforms are popular with young operators across all levels of education but adoption rises to nearly 70% for those with a post-graduate degree (e.g. Master’s or Ph.D.). Focusing on education, large differences in software use across age groups are most apparent at the end of the education spectrum. These differences may highlight trends in educational attainment over time. Among older operators, having some college represents a relatively high level of educational attainment while younger operators require more education to distinguish themselves. Adoption of software platforms may be related to the degree to which operators and operations specialize.
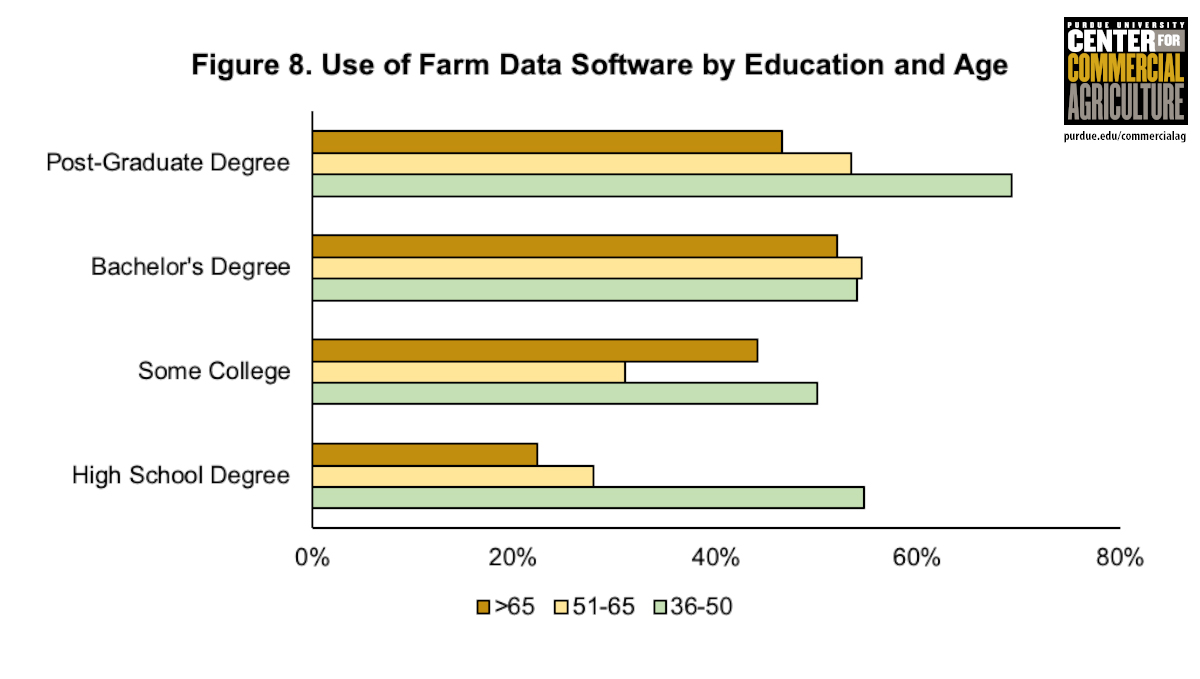
Figure 8. Use of Farm Data Software by Education and Age
Farmers that use at least one data service platform were asks to identify all of the products they currently subscribe to from a list of eight popular brands (see Figure 9).[5] The most widely used software product is Climate FieldView (Bayer), used by over half of surveyed software subscribers. Forty-four percent use John Deere Operations Center while 22% use Case IH’s AFS Software platform—generally reflecting their respective market shares for farm equipment. Trimble is the next most frequently used at 21%, followed by Farmers Business Network (FBN) (19%), Corteva’s Encirca (14%), FarmersEdge (10%), and Granular (also Corteva) at 9%.[6] Nearly one fourth of users subscribe to a service not listed in the survey, suggesting a long tail in the farm data software market. Understanding what types of solutions make up this tail is worthy of future investigation.

Figure 9. Types of Software Used by Software Users (n=353)
Though all of the software brands listed provide farm data solutions, there is a significant amount of product differentiation. Operations Center and AFS platforms collect telematics and as-applied seed and chemical data from their respective equipment (though they are capable of integrating with other data sources). FBN is primarily a data aggregator for input cost and performance benchmarking. Other products provide cloud-based storage and analysis of agronomic data for in-field decision making (e.g. FieldView and FarmersEdge) while Granular provides a broad set of solutions from workflow management to land valuation. It is not surprising then that 70% of software users subscribe to more than one product (see Figure 10). Our survey indicates that 63% of subscribers receive seed or fertilizer application recommendations (prescriptions) from their software. However, farmers do not treat software recommendations as directives. Only 44% follow their software recommendations “closely” while 52% follow “somewhat closely,” and 4% do not follow recommendations at all.

Figure 10. Number of Farm Data Software Products Used (n=353)
On average, farms use between two and three software platforms but almost 90% subscribe to three or fewer. Given the growth of investment in farm-facing technology companies, it may be difficult to incent existing adopters to add another product to their software suite. Companies could instead target non-adopters. Figure 11 shows that, of farmers not using any farm data software, close to half indicate uncertainty in how to use the technology as the primary reason for not subscribing. Forty-one percent of non-adopters perceive farm data software as too costly or the associated benefits unclear, indicating a breakdown in value proposition. Privacy concerns are again surprisingly unimportant as a deterrent to software use—only 12% identified privacy as the main reason for not subscribing to farm data service.
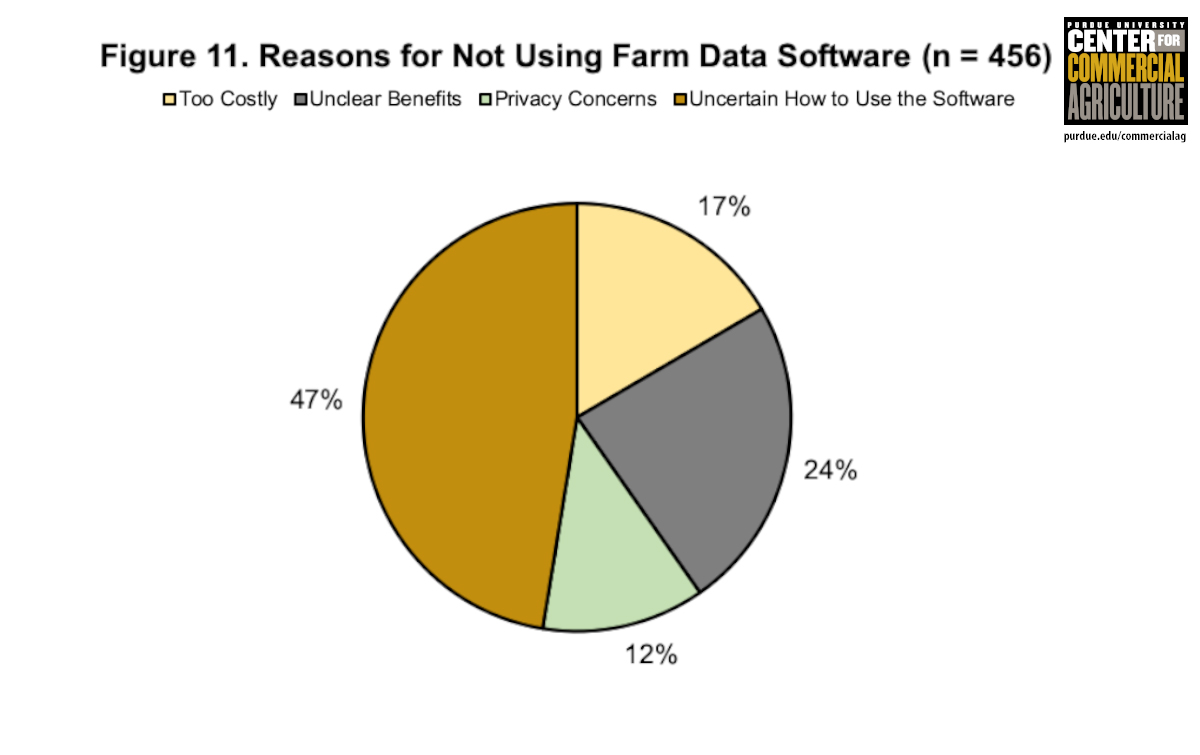
Figure 11. Reasons for Not Using Farm Data Software (n=456)
In addition to within-farm data management, farmer participants were asked about their data sharing habits with outside service providers. Specifically, farmers were asked if they share their data with agronomists, agricultural input suppliers, and equipment dealers/manufacturers for the purpose of generating crop management recommendations. Over 70% of respondents share their farm data with at least one service provider and of these, 63% share with two or more. Figure 12 shows farmers are most willing to share data with service providers that operate close to on-farm crop management decisions. Fifty-eight percent of farms share data with their agronomist followed by ag input suppliers at 44%. Only 12% report sharing their data with equipment dealers and 7% share with a service provider not listed in the survey.
Surprisingly, the share of farms that follow recommendations provided by outside service providers “very closely” is 31%, 13 percentage points lower than the share that follow their software recommendations closely. Even when comparing the same sub-sample of respondents that get recommendations from both software and service providers (191 farms) the differential remains significant (about 10 percentage points). The willingness to follow software generated recommendations over those provided by an outside advisor may be due to a perception that service providers—particularly ag input suppliers—pair recommendations with product sales.
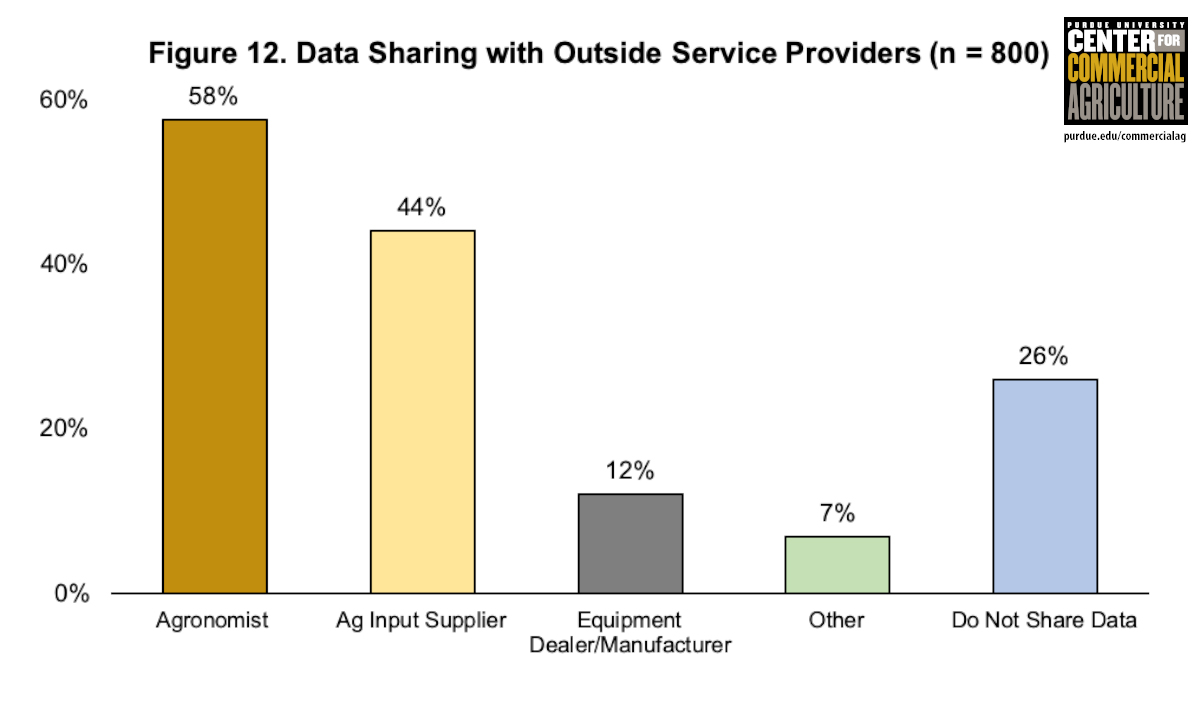
Figure 12. Data Sharing with Outside Service Providers (n=800)
About 15% of data-collecting farms neither use farm data software or share data with outside service providers. For this cohort, data is siloed on the farm and is unlikely to be made actionable. Only 8% subscribe to a software platform but do not share their data vs. 38% who only share and do not use software while 39% do both. Farms already performing one data management practice (software or sharing) are more likely to adopt another. This is particularly true for data sharing vs. non-sharing. Over 50% of farms that share data also subscribe to a software platform compared to 36% of those that do not currently share data.
Tables 2 and 3 show how combining different data management practices is related to on-farm decision making and the resulting yield outcomes. Table 2 shows that farm data is more influential in the crop management decisions of farms that subscribe to a data software platform or share their data with an outside service provider. Farms that perform both data management practices are over four times more likely to make seeding rate decisions that are “highly influenced” by data than farms that collect data but do not share or use software. The proportion of data-driven fertilizer decisions among the software plus sharing cohort is over twice that of the no-software, no-sharing group.
Table 2 indicates that software use is positively associated with the degree to which data influences drainage investments. Data sharing however, has little to no impact on the importance of data in drainage decisions. In fact, among software users, those that also share data are slightly less likely to report their drainage decisions as being highly influenced by data. This could be channeling the role of aerial imagery and mapping in drain tile installation (software subscribers are twice as likely to collect drone or satellite data and 45% more likely to create GPS maps with their data than non-software users).
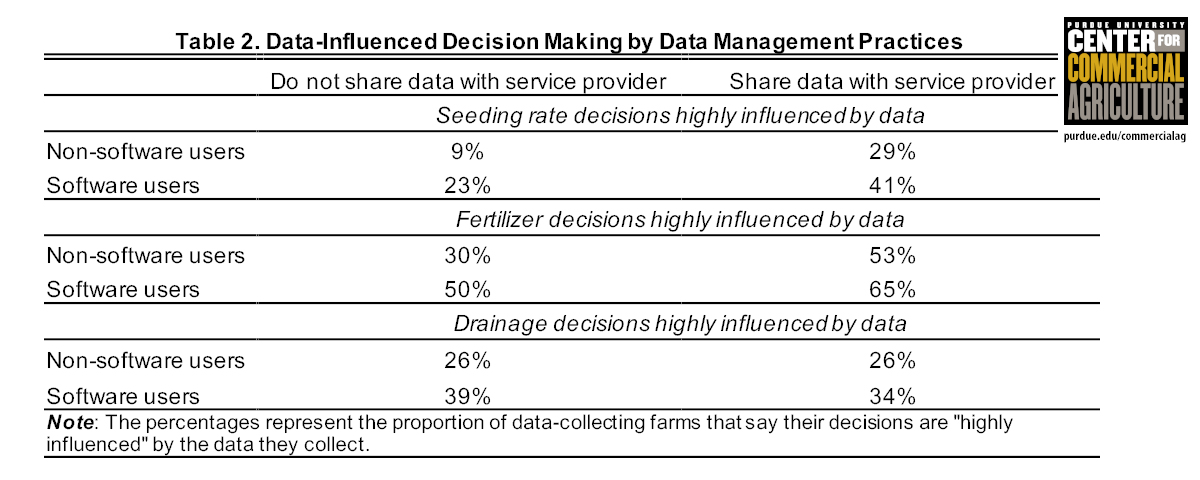
Table 2. Data-Influenced Decision Making by Data Management Practices
Table 3 cross-tabulates the proportion of farms reporting a positive yield impact from their data-informed decisions by software use and sharing practices. Again, farms that subscribe to a data software product are more likely to report increased yields as are farms that share data with an agronomist, input supplier, dealer, or other service provider. The difference is especially large for seeding rate decisions. Compared to farms with no active data management strategy, farms that use software and share data are 60% more likely to make yield-increasing seeding-rate decisions.
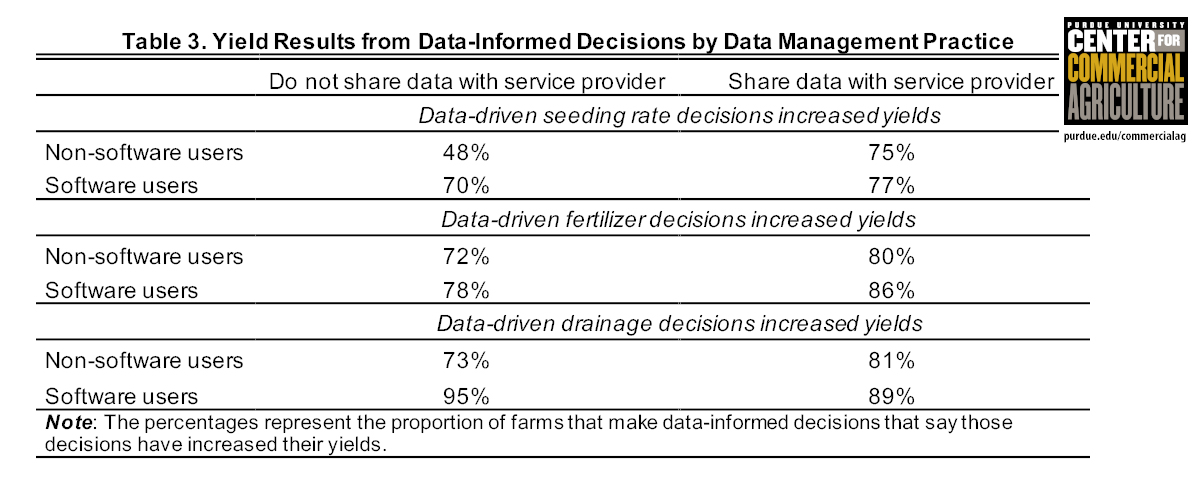
Table 3. Yield Results from Data-Informed Decisions by Data Management Practice
Conclusion
Despite intense interest in agricultural data among the farm press and venture capital, little is known about how farms actually collect, manage, and analyze data. This survey provides a useful glimpse into the farm data lifecycle from collection to action to evaluation. We find that among large commercial corn and soybean operations, data collection is common (92% collect at least one type of farm data) and that collection is strongly related to farm characteristics. Large farms, farms with younger operators, and farms with high educational attainment are the most likely to collect and use farm data. Farms not currently pursuing a data strategy are unconvinced by the value proposition and are unlikely to begin collecting farm data in the near future. Most farms that collect data say that it has at least some influence in their seeding, fertilizer, and drainage decisions and the vast majority report a positive yield impact from their data-informed decisions.
Active data management practices can increase these perceptions. Use of variable rate technology (VRT) is a strong predictor of the importance of data in seeding rate and fertilizer application decisions while the influence of data on drainage decisions rises with the collection of drone or satellite imagery and use of GPS mapping. Results show that about half of farms collecting data subscribe to a farm data software platform and using multiple software products simultaneously is not uncommon. Again, larger, younger, and more educated operations are the most likely to adopt a farm data platform. Privacy issues, both at the collection and software adoption stage, are surprisingly unimportant relative to those regarding usability and profitability. Over 70% of farms are willing to share their data with an outside service provider—most commonly agronomists and ag input suppliers. Farmers are more likely to closely follow recommendations generated by their ag data software than those provided by outside service providers. This is true even among the subset of farms that receive recommendations from both sources.
Overall, farms that use an ag data software product and share data with an outside consultant are significantly more likely to make data-informed management decisions. They are also more likely to regard those decisions as yield-enhancing. Often ag data ends up siloed on the farm, stored on desktops or USB flash drives collecting dust in a shop drawer. These survey results suggest that pro-actively managing and analyzing farm data can improve decision making and generate positive yield results. Understanding how data management practices shape on-farm decision making is of crucial importance in bringing the farm of the future into reality. Downstream players in the agricultural value chain must recognize the data needs of growers as data transparency and data integration demands rise.
References
[1] AgFunder. AgFunder AgriFood Tech Investing Report: 2018 Year in Review. (2019). Available at https://agfunder.com/research/agrifood-tech-investing-report-2018/
[2] 2017 USDA Census of Agriculture
[3] Schimmelpfennig, D. (2016). Farm Profits and Adoption of Precision Agriculture. U.S. Department of Agriculture, Economic Research Service Report No. 217, Washington, D.C.;
Thompson, N. M., C. Bir, D. A. Widmar, J. R. Mintert. (2018). Farmer Perceptions of Precision Agriculture Technology Benefits. Journal of Agricultural and Applied Economics 51(1): 142-163.
[4] Figure 8 excludes the under 20 and 20-35 age groups due to insufficient observations in each education category.
[5] The list of farm data software products was developed from a previous survey of farm data software users and from internet search data provided by Google Trends.
[6] Recently, Encirca was merged with the Granular software suite to become Granular Agronomy by Encirca.

![]()
![]()
![]()
![]()
![]()
TAGS:
TEAM LINKS:


RELATED RESOURCES
UPCOMING EVENTS
We are taking a short break, but please plan to join us at one of our future programs that is a little farther in the future.